The forest area calculation formula helps determine the scale of natural forests, planted forests, and changes in forest area over different periods. Depending on the purpose, you can apply the natural forest area calculation formula, planted forest area calculation formula within total forest area, forest area increase calculation formula, or average annual increase in planted forest area calculation formula. In addition to traditional calculation methods based on inventory data, 3D scanning technology combined with LiDAR + SLAM also provides a new approach to faster and more detailed spatial measurement and data collection.
.jpg)
In forest inventory, area is generally determined based on the boundaries of each forest area or forest compartment on a map. The commonly used unit of measurement is the hectare (ha).
Forests in Vietnam are classified according to various criteria, with natural forests and planted forests being two commonly used categories when calculating forest area.
Forest area = Total area of all forested areas
Example: An area contains 4 forest compartments measuring 120 ha, 250 ha, 180 ha, and 300 ha respectively. The total forest area is:
120 + 250 + 180 + 300 = 850 ha
From this total area, it is possible to further determine natural forest area, planted forest area, the proportion of planted forests, and increases or decreases in forest area over different periods.
Natural forest area = Total forest area - Planted forest area
Where: Planted forest area includes newly planted forests, plantations that have not yet reached canopy closure, and established planted forests.
Example:
→ Natural forest area: 10,000 - 3,500 = 6,500 ha.
This formula is only appropriate when the two area categories are classified within the same scope, at the same point in time, and do not overlap.
In actual forest inventory, the area should be determined from maps, compartment boundaries, and forest-status classification results rather than being estimated solely from aggregated figures.
To determine the proportion of planted forest area within the total forest area, use the following formula:
Planted forest proportion (%) = (Planted forest area / Total forest area) × 100
For example, if an area contains 3,500 ha of planted forest out of a total forest area of 10,000 ha:
Planted forest proportion = (3,500 / 10,000) × 100 = 35%
If you need to calculate the planted forest area rather than its proportion, simply use the planted forest area identified on the inventory map.
It should be noted that the proportion of planted forests is not the same as forest cover. Forest cover is a different indicator, which is aggregated by administrative unit and reflects the proportion of forested area relative to the natural area within the calculated scope.
To determine the increase or decrease in forest area between two points in time, use:
Forest area increase/decrease = Forest area in the later period - Forest area in the earlier period
Example:
Therefore: Forest area increase = 12,450 - 12,000 = 450 ha
If the result is negative, the forest area has decreased.
You can also calculate the percentage rate of change:
Increase/decrease rate (%) = [(Area in later period - Area in earlier period) / Area in earlier period] × 100
For the example above:
Increase rate = (450 / 12,000) × 100 = 3.75%
In forest change monitoring, determining changes should not rely solely on the increase or decrease figure. The causes of change should also be identified, such as afforestation, forest restoration, forest fires, pests and diseases, deforestation, land-use conversion, or clear-cutting. These are also categories of causes used in forest area change statistics.
When the planted forest areas at two points in time and the period between them are known, the average annual increase can be calculated as follows:
Average annual increase in planted forest area = (Planted forest area in later period - Planted forest area in earlier period) / Number of years
Example:
Therefore: Average annual increase = (2,750 - 2,000) / 5 = 150 ha/year
This is an arithmetic average increase. It should not be interpreted as meaning that the actual forest area increased by exactly 150 ha every year. To assess annual changes, annual inventory or statistical data should be used.
Manual measurement methods, such as delineating areas on paper maps, measuring with tape, or using handheld GPS devices, have revealed significant limitations when applied to areas with complex terrain.
Today, these methods can be combined with remote-sensing image interpretation or aerial imagery, supplemented by field surveys. The data is then compiled into digital maps to determine boundaries and calculate the area of different forest conditions.
However, when deployed across large areas with steep terrain or numerous obstacles, the survey process still requires significant human resources, time, and data quality control.
LiDAR is a technology that uses laser pulses to measure the distance between a sensor and surrounding objects. When integrated into a 3D scanning device, LiDAR can collect a large number of data points about the surrounding environment.
When combined with SLAM, the device can move through an area while simultaneously recording its position and generating a Point Cloud (3D point cloud) of the forest area.
This data helps describe terrain, trees, and spatial structures, supporting faster forest area measurement and analysis. LiDAR is also used in studies of tree height, canopy cover, and forest structure.
3D scanning technology combined with LiDAR/SLAM offers several advantages that address the limitations of traditional methods:
.jpg)
To use 3D scanning for forest area calculation, a process should be established from field surveying to data processing and verification.
Before scanning, the area to be measured and the purpose of the data must be clearly defined.
If the data is intended for official inventory purposes, the method for integrating 3D scanning data with maps, management records, and other data sources should be determined from the beginning.
Technicians determine suitable routes to ensure good data coverage.
The operator should not simply move in a straight line through the forest. Scanning routes should be designed to minimize occluded areas and provide sufficient overlap when combining scanning segments.
With SLAM-based equipment, maintaining appropriate movement routes and creating loop closures can help the system maintain a more stable trajectory.

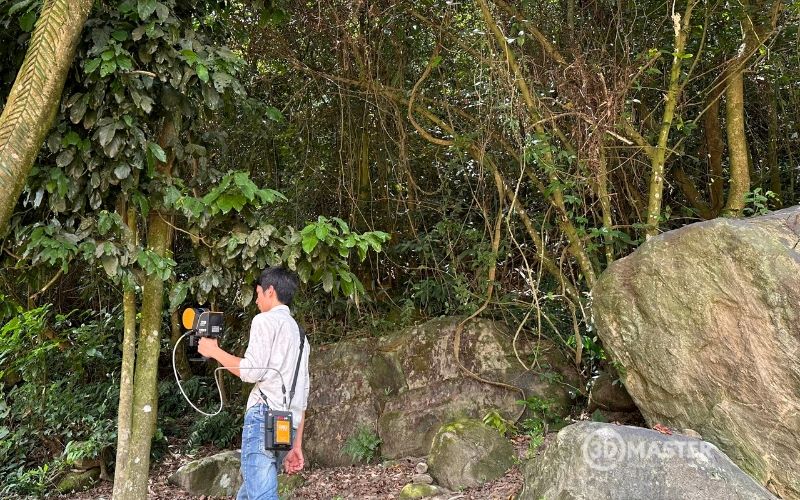
Technicians carry the 3D scanning device and move along the planned routes. LiDAR continuously records the distance and shape of surrounding objects. At the same time, SLAM helps determine the device's position in space.
During this process, it is necessary to:
The resulting output is a 3D Point Cloud of the surveyed area.
.jpg)
Raw data needs to be inspected before calculations are performed.
Common steps include:
This is an important step because even a high-quality Point Cloud can produce inaccurate area calculations if it is not processed correctly.
After the Point Cloud has been processed, the data can be imported into specialized software to determine the boundaries of the area to be calculated.
The area can be calculated based on the principle:
Area of the surveyed region = Total area of all identified zones/forest compartments within the survey boundary
If natural forest and planted forest areas need to be determined, each area must first be classified before the results are aggregated.
The results should be cross-checked against forest inventory maps, remote-sensing data, and management records. Forest inventory regulations also require the delineation of forest conditions, the development of digital maps, and area calculations according to management units.
Finally, the implementing organization verifies the results against field data and existing data sources.
The report may include:
For forest area change monitoring, a single Point Cloud dataset should not be used alone to determine the causes of increases or decreases. Maps, remote-sensing imagery, management records, and field verification should be combined when necessary.
3D Master is a pioneering provider in Vietnam of comprehensive solutions for 3D measurement technology, 3D scanning services, and 3D digitization of forestry resources.
With an experienced team of specialists, the company is ready to deploy 3D measurement and digitization solutions for forest owners, protection forest management boards, and forestry projects nationwide.
In addition, the company provides software solutions for extracting forest data, calculating area, calculating carbon credits, and automatically and accurately calculating timber volume.
At 3D Master, the equipment commonly used for forest surveying applications is the GeoSLAM ZEB Horizon 3D scanner, which can scan within a range of up to 100 m and provides extremely fast scanning speed.
After scanning, the data can be further processed using specialized software to create models, perform measurements, and extract information according to the project's objectives. 3D Master also provides on-site 3D scanning and post-processing services.
In summary, understanding the forest area calculation formula helps improve the accuracy of forest statistics, monitoring, and change assessment. For large areas or difficult-to-access terrain, 3D scanning technology combined with LiDAR and SLAM can support fast and detailed data collection, making the measurement process more convenient.
>>> Get consultation on 3D forest area calculation solutions today!
3D Master Contact Information: